



Blackjack House Edge: The Math, Every Rule Set and What It Means for Your Session
Blackjack house edge explained with exact math and 51 billion simulated rounds: 0.41% on a good 6-deck 3:2 table, every common rule set from −0.16% to 2.16%, variance, session swings and bankroll risk.
On this page
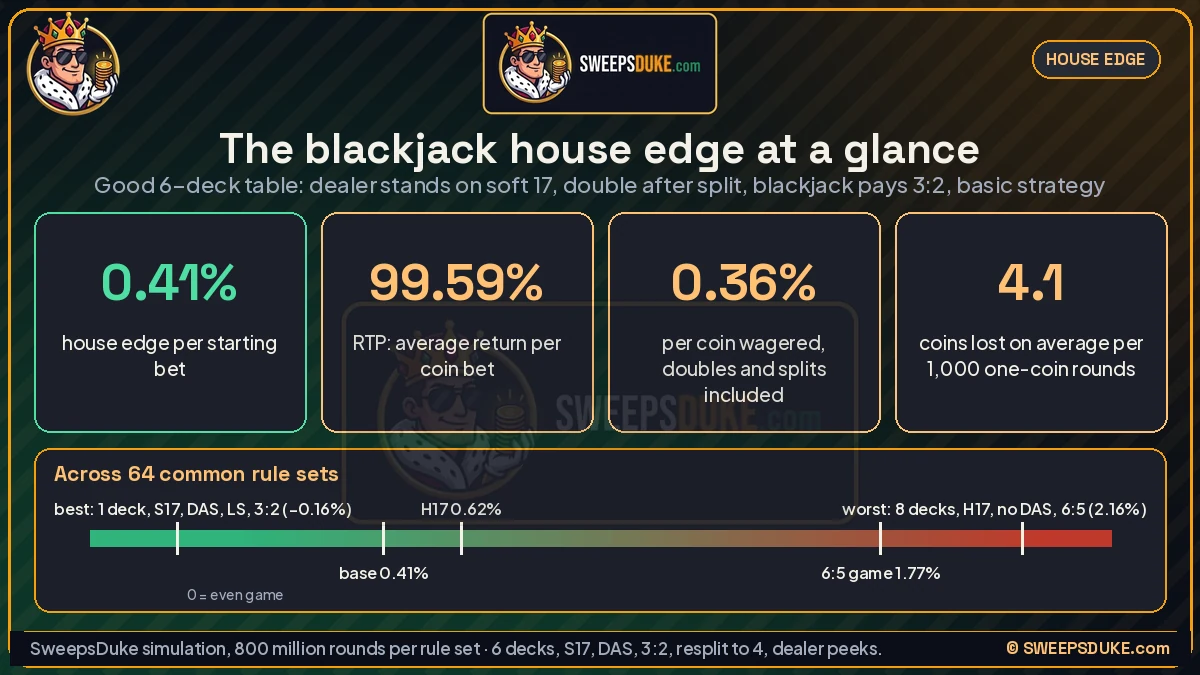
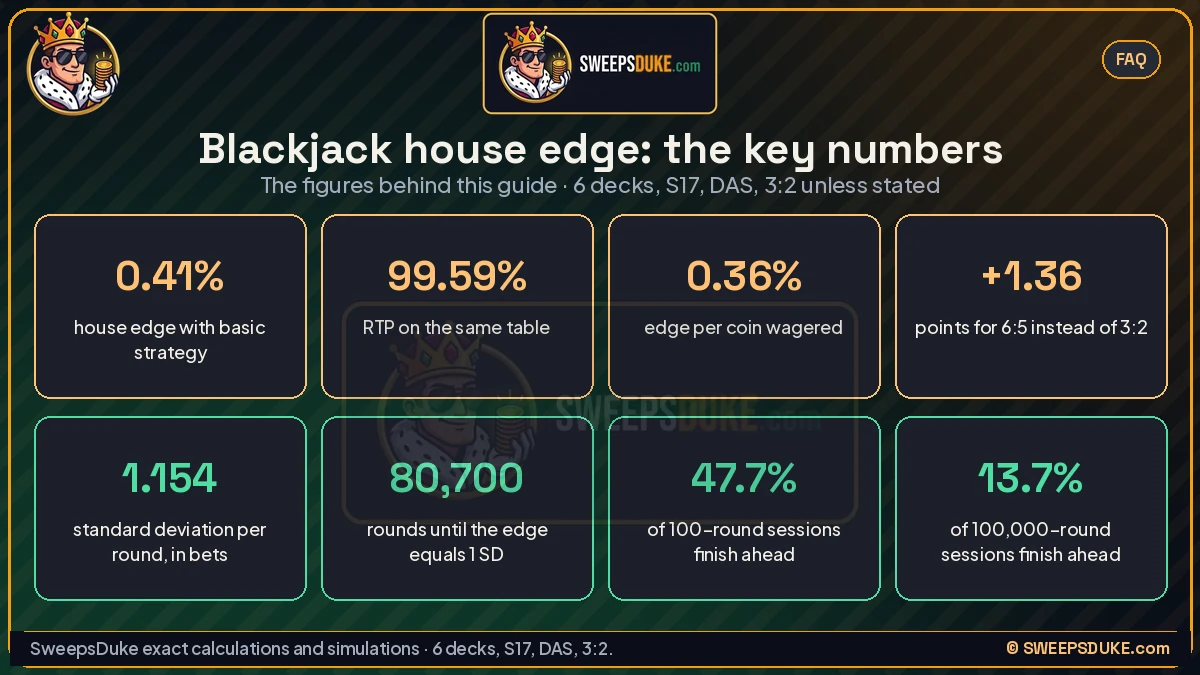
The blackjack house edge is the average share of each starting bet the game keeps over the long run. On a good table (6 decks, dealer stands on soft 17, double after split, blackjack pays 3:2) it is 0.41% with perfect basic strategy. That's 41 coins per 10,000 coins of starting bets, on average, and an RTP of 99.59%.
That one number hides a lot. It changes with the rules, from a small player edge on the best single-deck game we tested to more than 2% on a bad 6:5 shoe. It tells you almost nothing about a single session, because blackjack's swings are about 280 times bigger per round than the edge. This page works through the math behind the number: how it's calculated, how precise it is, what every common rule set costs, and how long it takes before the edge, rather than luck, decides your result.
Affiliate disclosure: SweepsDuke may earn a commission if you sign up through some links on this site. That never changes our charts, math or verdicts. How we make money.
The blackjack house edge at a glance
| Question | Short answer | Where it comes from |
|---|---|---|
| House edge, good 6-deck 3:2 table | 0.41% of each starting bet | 800 million simulated rounds; exact calculation gives 0.40% |
| RTP on the same table | 99.59% | 100% minus the edge |
| Edge per coin actually wagered | 0.36% | Doubles and splits add 13.2% more coins, mostly in good spots |
| Best common rule set we tested | 0.16% player edge (1 deck, S17, DAS, late surrender, 3:2) | Rule-set simulation |
| Worst common rule set we tested | 2.16% house edge (8 decks, H17, no DAS, no surrender, 6:5) | Rule-set simulation |
| Size of one round's swing | 1.15 starting bets (one standard deviation) | Simulation and the outcome distribution |
| Rounds before the expected loss equals one standard deviation | About 80,700 | (1.154 ÷ 0.004062)² |
| Chance to finish ahead after 100 rounds | 47.7% | 2 million simulated sessions |
| Chance to finish ahead after 100,000 rounds | 13.7% | 20,000 simulated sessions |
All figures assume one player using basic strategy and flat bets. If you play by feel, the edge is several times bigger (see the playing-style summary below). If you want the rules themselves explained, start with our blackjack rules guide. If you're new to the game, what is blackjack covers the basics first.
What house edge means: a long-run average, not a fee per session
The house edge is an expected value: the average result per starting bet if you could play the same game forever. Formally, if X is your net result on one round in starting bets, the house edge is −E[X]. With our base rules, E[X] = −0.0041, so you lose 0.41% of a starting bet per round on average.
"On average" is doing all the work in that sentence. No single round ever costs 0.41%. Almost every round ends in one of a handful of results: you lose your bet (43.4% of rounds), win even money (32.6%), push (8.8%), win a doubled bet (5.9%), lose a doubled bet (4.2%), or get paid 3:2 on a blackjack (4.5%). The 0.41% is what's left when you weight each of those results by how often it happens and add them up.
What makes the average meaningful is the law of large numbers. As the number of rounds grows, your average result per round settles towards −0.41%. It doesn't happen by the game "correcting" earlier luck. Earlier results are simply diluted by more and more new rounds.
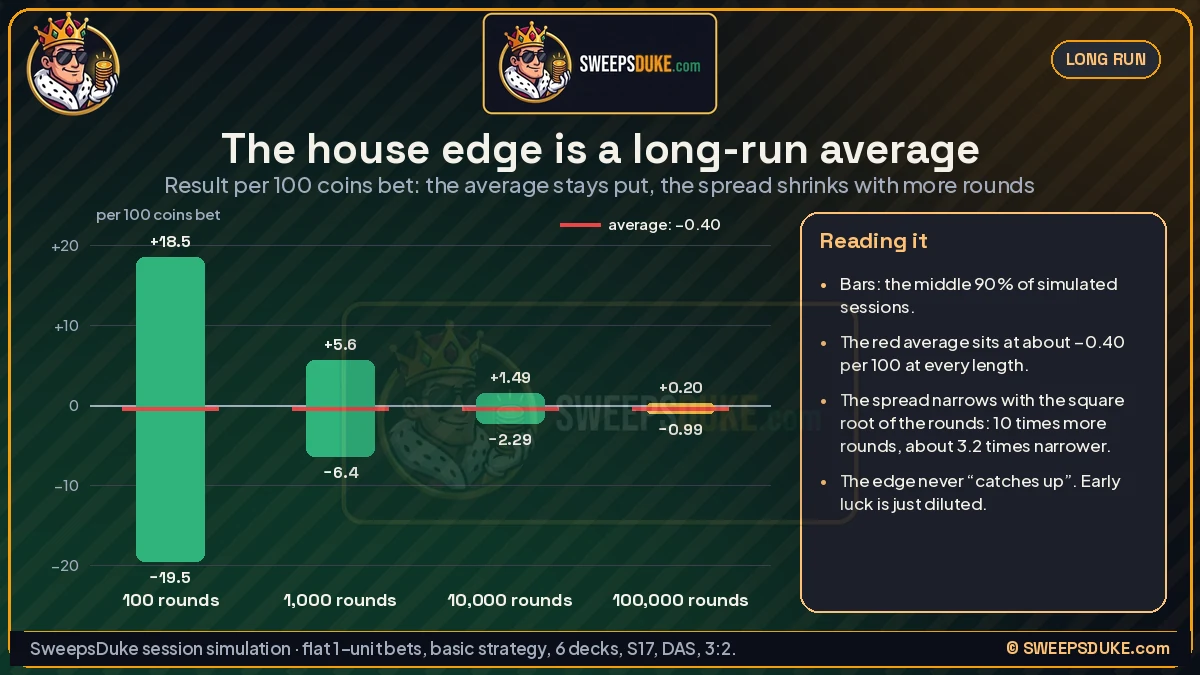
Our simulations show the convergence directly. Here is the middle 90% of results per 100 coins bet (one-coin flat bets, base rules):
| Rounds played | Average result per 100 coins bet | Middle 90% of sessions, per 100 coins bet |
|---|---|---|
| 100 | −0.40 | −19.5 to +18.5 |
| 1,000 | −0.40 | −6.4 to +5.6 |
| 10,000 | −0.40 | −2.29 to +1.49 |
| 100,000 | −0.40 | −0.99 to +0.20 |
The average barely moves: it's −0.40 to −0.41 per 100 at every length, within simulation noise. The spread around it is what shrinks, roughly with the square root of the number of rounds. Ten times more rounds makes the range about 3.2 times narrower.
Three practical consequences follow:
- The edge is charged on what you bet, not on what you bring. Playing 1,000 one-coin rounds costs about 4 coins on average whether you started with 50 coins or 5,000.
- It applies per round, so speed matters. At 100 rounds an hour, the expected cost is 0.41 starting bets an hour. At 500 rounds an hour on a fast online table, it's 2.0. Same edge, five times the expected cost per hour.
- It's a property of the game and your decisions, not of you. A lucky night doesn't lower it and an unlucky one doesn't raise it.
House edge vs RTP vs hold
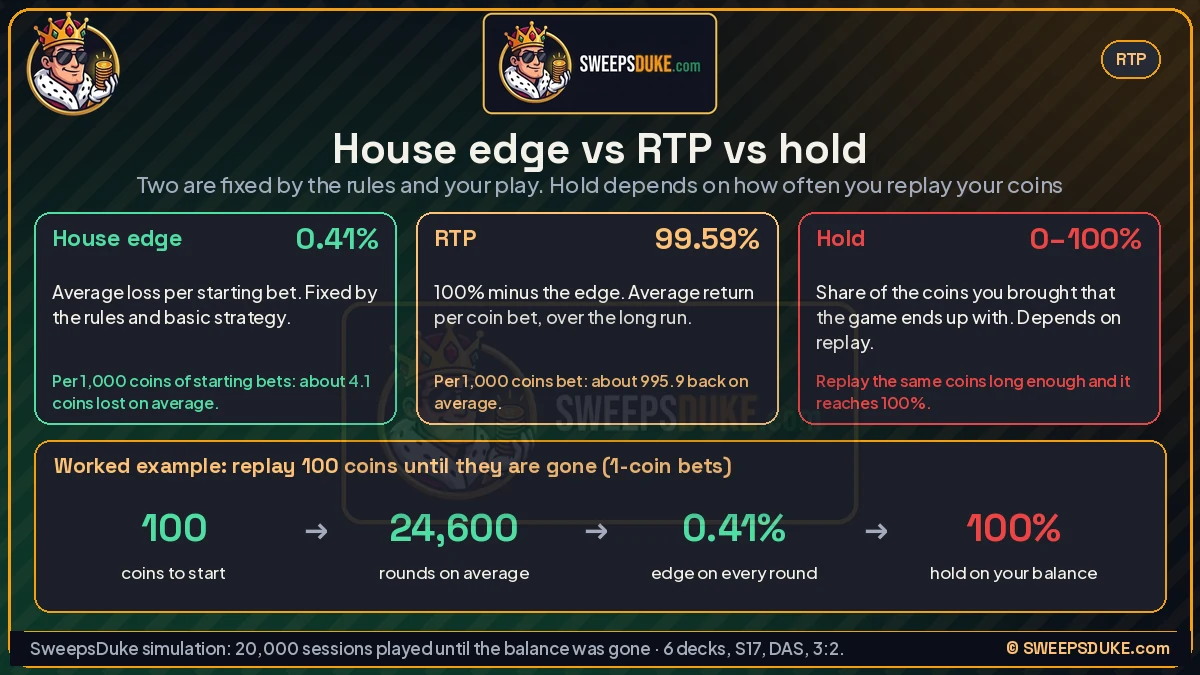
Three numbers get mixed up all the time. They measure different things.
| Term | Definition | Blackjack, base rules | What it tells you |
|---|---|---|---|
| House edge | Average loss ÷ starting bet | 0.41% | Cost per round, in starting bets |
| RTP (return to player) | 100% − house edge | 99.59% | Average return per coin bet, over the long run |
| Element of risk | Average loss ÷ total coins wagered (including doubles and splits) | 0.36% | Cost per coin that actually went on the table |
| Hold | Coins kept by the game ÷ coins the player brought | Anywhere from 0% to 100% | What happened to your balance, which depends on how long you kept replaying it |
The first three are fixed by the rules and your play. Hold is not. It depends on how many times you recycle your balance.
Worked example. Start with 100 coins, bet 1 coin a round, and keep playing until the balance is gone. In our simulation of 20,000 such sessions, the balance lasted 24,600 rounds on average. That matches the math: when you play until ruin, expected rounds = bankroll ÷ edge per round = 100 ÷ 0.004062 ≈ 24,600. Over those rounds you'd bet about 24,600 coins in starting bets, close to 28,000 coins including doubles and splits. The game "kept" 0.41% of each starting bet, but because you kept replaying the same 100 coins, the hold on your balance was 100%.
That's why a 99.59% RTP doesn't mean you'll leave with 99.59% of what you started with. RTP is a return per coin bet. Every coin can be bet many times.
House edge per initial bet vs per total coins wagered
Blackjack is unusual because your stake can grow during a round. You double, you split, and sometimes you split again. So "per coin bet" has two possible meanings.
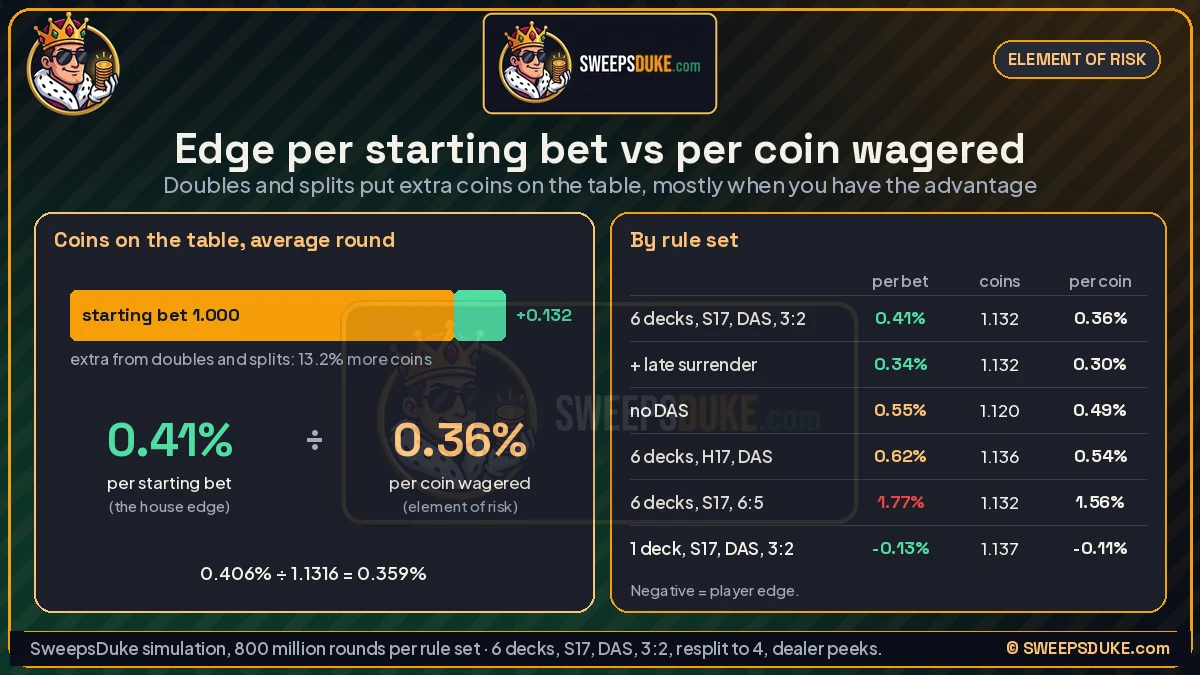
- Per initial bet (the standard house edge). Divide the average loss by the starting bet only. This is the figure quoted almost everywhere, and the one on this page unless we say otherwise.
- Per total coins wagered (element of risk). Divide the average loss by everything you put on the table, doubles and splits included.
In our base-rules simulation, the average round puts 1.1316 starting bets on the table. Doubles and splits add 13.2% more coins. The edge per total coins wagered is therefore 0.406% ÷ 1.1316 = 0.36%.
Why is it lower? Because the extra coins go in when you have the advantage. You double 11 against a 6, not 12 against a 10. Basic strategy only adds money when doing so improves your expected result, and most of those spots are ones where you're the favourite. So those extra coins carry a better return than the starting bet, and spreading the same loss over more coins lowers the rate.
| Rule set | Edge per starting bet | Coins wagered per round | Edge per coin wagered |
|---|---|---|---|
| 6 decks, S17, DAS, 3:2 (base) | 0.41% | 1.132 | 0.36% |
| Same with late surrender | 0.34% | 1.132 | 0.30% |
| Same without DAS | 0.55% | 1.120 | 0.49% |
| 6 decks, H17, DAS, 3:2 | 0.62% | 1.136 | 0.54% |
| 6 decks, S17, DAS, 6:5 | 1.77% | 1.132 | 1.56% |
| 1 deck, S17, DAS, 3:2 | 0.13% player edge | 1.137 | 0.11% player edge |
Which one should you use? For comparing tables, either, as long as you compare like with like. For estimating your cost, the standard per-starting-bet figure is easier: expected loss = edge × number of rounds × starting bet. You don't need to track how often you doubled.
How the house edge is calculated: the exact math
There are two ways to get a blackjack house edge: combinatorial analysis (exact calculation) and simulation. The first was done by hand in 1956 by Baldwin, Cantey, Maisel and McDermott, the four Army engineers who first published basic strategy. Their estimate put the game within about 1% of even. Modern computer analysis does the same thing card by card.
The exact method works like this:
- Fix the rules and the strategy. Every number on this page is for basic strategy, a fixed decision for each hand total against each dealer upcard. See our basic strategy guide.
- For each starting situation, work out the probabilities. Your two cards and the dealer's upcard fix what's left in the shoe. From there, compute the probability of each dealer final total (17, 18, 19, 20, 21 or bust), and the probability of each of your results for every action.
- Take the expected value of the chosen action. EV = Σ probability × payout, over every possible ending.
- Weight by the chance of each starting situation and add up.
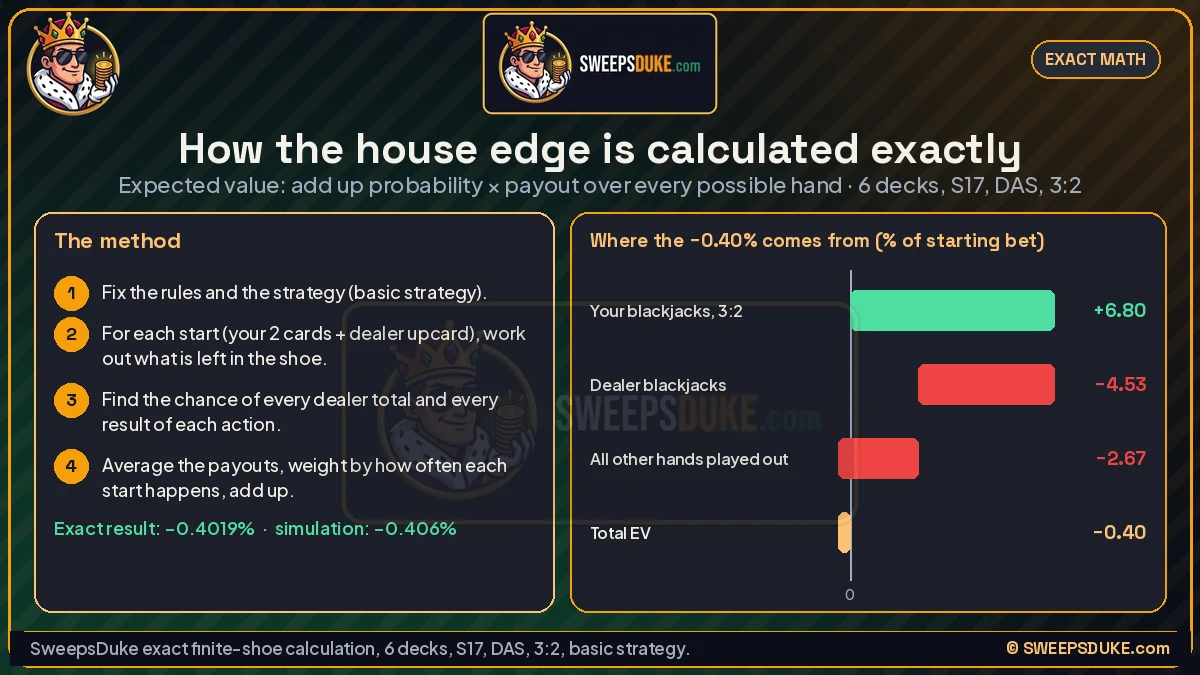
Our exact finite-shoe calculation for 6 decks gives an expected value of −0.4019% for S17 and −0.6147% for H17. Simulation of the same rules gives −0.406% and −0.618%. They agree to within about one standard error of the simulation.
Some of the pieces are simple enough to do by hand, and they show how a rule turns into a number.
Worked example 1: the blackjack payout. In a 6-deck shoe (312 cards, 24 Aces, 96 ten-value cards), the chance of being dealt a blackjack is 2 × 24/312 × 96/311 = 4.749%. You only get paid if the dealer doesn't also have one. Given your Ace and 10, the dealer's chance of a blackjack is 2 × 23/310 × 95/309 = 4.56%. So a paid blackjack happens on 4.749% × (1 − 0.0456) = 4.532% of rounds. A 6:5 payout pays 0.3 of a bet less than 3:2 each time, so it costs 0.3 × 4.532% = 1.36 points of house edge. Our simulation measures the 6:5 penalty at 1.360 points. A 1:1 payout costs 0.5 × 4.532% = 2.27 points.
Worked example 2: insurance. The dealer shows an Ace and you hold two non-ten cards. Of the 311 unseen cards (ignoring yours for simplicity), 96 are tens. Insurance pays 2:1, so per coin insured: EV = 2 × 96/311 − 1 × 215/311 = −23/311 = −7.4%. Count your own two non-ten cards as seen and it's −21/309 = −6.8%. Insurance is a separate side bet, and it's always a poor one for a basic-strategy player.
Worked example 3: even money. You hold a blackjack, the dealer shows an Ace. Taking even money pays 1 bet for sure. Declining pays 1.5 bets unless the dealer has a ten underneath: 95 tens among 309 unseen cards. Expected value of declining = 1.5 × (1 − 95/309) = 1.039 bets. Even money costs you 3.9% of the bet each time you take it.
Worked example 4: where the net comes from. Our exact calculation splits the base-rules EV into pieces:
| Piece | Contribution to EV, % of starting bet |
|---|---|
| Your blackjacks, paid 3:2 (4.532% of rounds × 1.5) | +6.80 |
| Dealer blackjacks against your non-blackjack (4.532% of rounds × −1) | −4.53 |
| Every other round, played out with basic strategy | −2.67 |
| Total | −0.40 |
The blackjack bonus alone is worth +2.27 points. You give it all back, and more, in the played-out hands. The main reason is order of play: you act first, so when you both would bust, you've already lost. Doubling, splitting and standing on stiff hands at the right time claw back most, but not all, of that disadvantage. Our what is blackjack page covers the double-bust effect in more detail.
The edge by dealer upcard
The exact calculation also tells you where the edge is won and lost. Here is your average result per starting bet against each dealer upcard, with base rules and basic strategy:
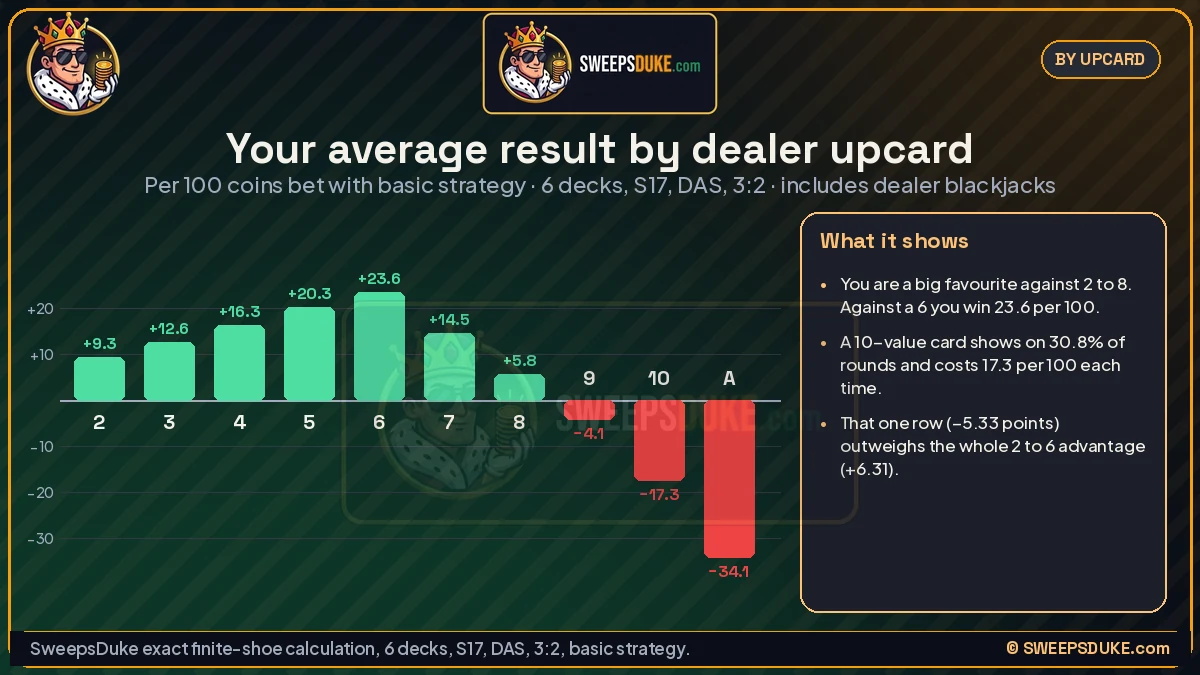
| Dealer upcard | Chance | Your average result per 100 coins bet | Contribution to overall EV |
|---|---|---|---|
| 2 | 7.7% | +9.3 | +0.71 |
| 3 | 7.7% | +12.6 | +0.97 |
| 4 | 7.7% | +16.3 | +1.25 |
| 5 | 7.7% | +20.3 | +1.56 |
| 6 | 7.7% | +23.6 | +1.81 |
| 7 | 7.7% | +14.5 | +1.11 |
| 8 | 7.7% | +5.8 | +0.44 |
| 9 | 7.7% | −4.1 | −0.32 |
| 10, J, Q, K | 30.8% | −17.3 | −5.33 |
| Ace | 7.7% | −34.1 | −2.63 |
| All | 100% | −0.40 | −0.40 |
These figures include the rounds where the dealer has blackjack, so the Ace and ten rows carry the dealer's naturals.
Two things stand out. First, you're a big favourite against 2 through 8. Against a 6 you win 23.6 coins per 100 bet on average, because the dealer busts 42% of the time and you can double and split freely. Second, the ten-value upcard does most of the damage. It shows up on almost a third of rounds and costs 17.3 per 100 each time. That single row, at −5.33 points, outweighs the whole advantage against 2 through 6 (+6.31).
The H17 rule only changes the rows where the dealer can end up with soft 17, which means the Ace and the small upcards. In our exact calculation H17 makes the Ace row worse by 0.24 points and the 6 row better by 0.02. Overall it costs 0.21 points exactly, 0.22 in simulation.
How simulation measures it, and how precise it is
Most rule sets are easier to simulate than to solve: deal billions of rounds, play each with the strategy, and average the results. The catch is noise. A simulation gives an estimate with a margin of error, and the margin shrinks slowly.
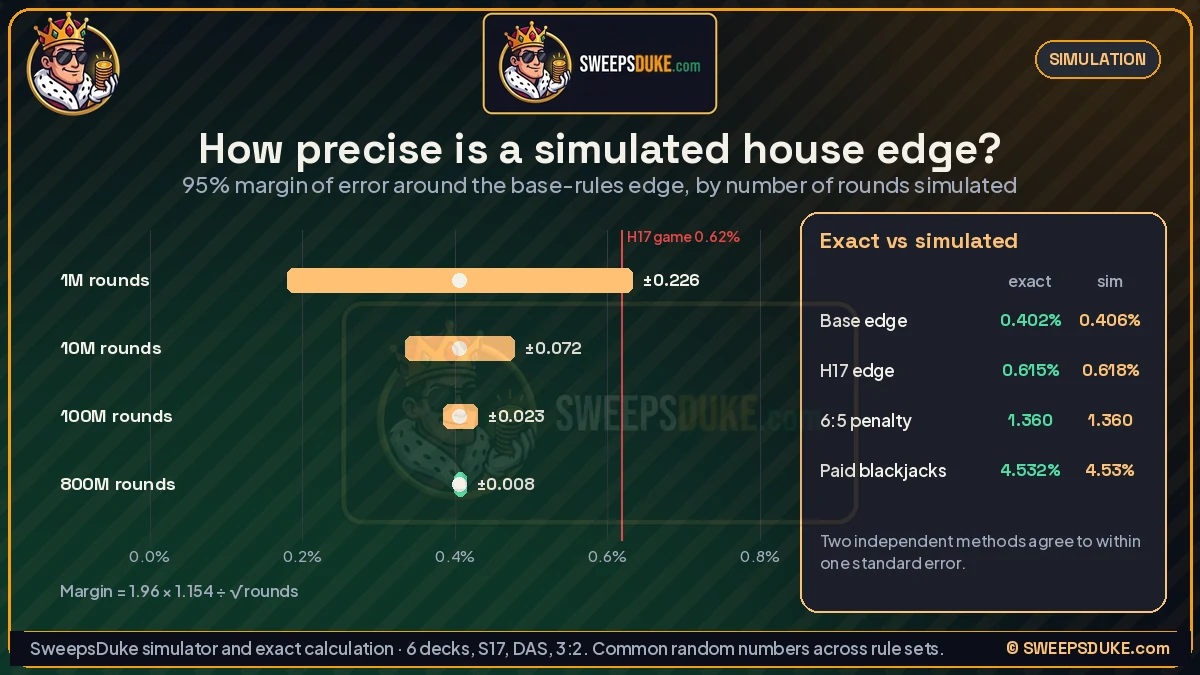
The standard error of the estimated edge is SD ÷ √n, where SD is the standard deviation of one round (1.154 starting bets) and n is the number of rounds:
| Rounds simulated | Standard error | 95% margin of error |
|---|---|---|
| 1 million | 0.115 points | ±0.23 points |
| 100 million | 0.0115 points | ±0.023 points |
| 800 million | 0.0041 points | ±0.008 points |
With a million rounds, you can't even tell a good 3:2 game (0.41%) from one with H17 (0.62%) with confidence. With 800 million rounds per rule set, which is what we ran, the margin is under one hundredth of a point.
We also used common random numbers: every rule set was dealt from the same eight seeded card streams. Rule sets that differ by one rule then see mostly the same cards, so the difference between them is measured far more precisely than either edge on its own. That's why our rule deltas are stable to the second decimal even when they're small, like +0.03 points for 8 decks instead of 6.
Finally, we checked the simulator against exact results. For the base rules: exact 0.402%, simulated 0.406%. For H17: exact 0.615%, simulated 0.618%. For the 6:5 penalty: exact 1.360 points, simulated 1.360. For the paid-blackjack rate: exact 4.532%, simulated 4.53%. When numbers from two independent methods match like this, both are probably right.
Blackjack house edge for every common rule set
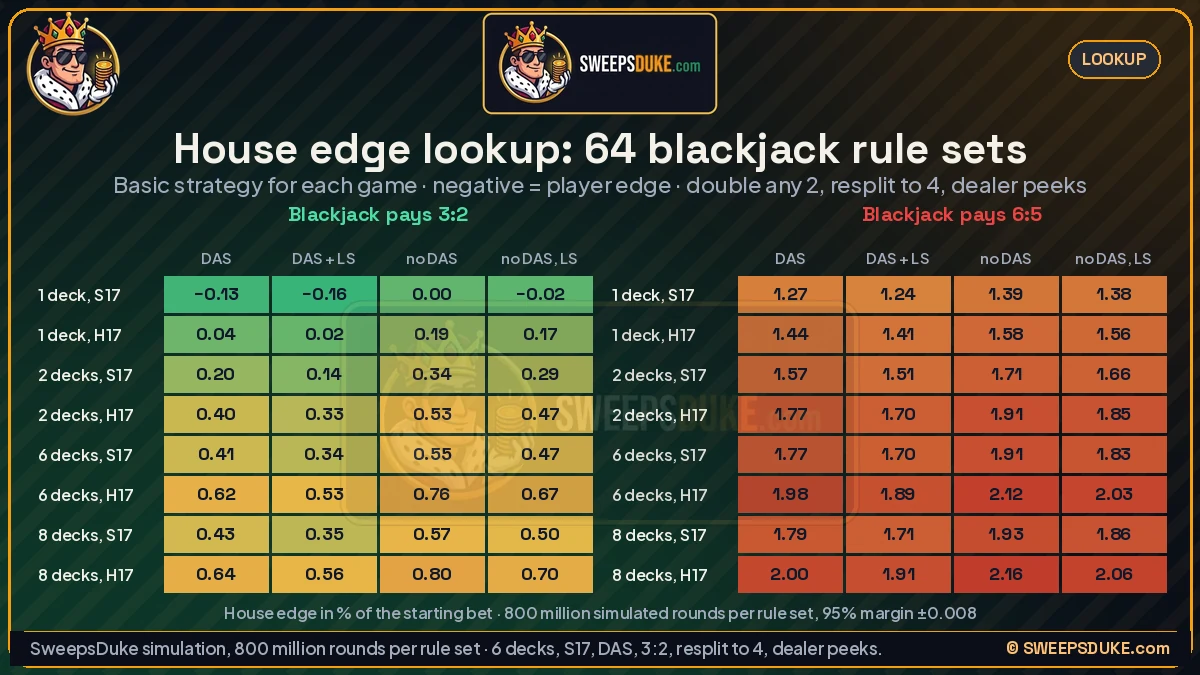
This is the lookup table: 64 rule sets, each simulated for 800 million rounds with basic strategy for that deck count and dealer rule. Negative numbers are a player edge. To get the RTP, subtract the edge from 100%. For example, 0.62% is 99.38% RTP.
Blackjack pays 3:2
| Decks and dealer rule | DAS, no surrender | DAS, late surrender | No DAS, no surrender | No DAS, late surrender |
|---|---|---|---|---|
| 1 deck, S17 | −0.13% | −0.16% | 0.00% | −0.02% |
| 1 deck, H17 | 0.04% | 0.02% | 0.19% | 0.17% |
| 2 decks, S17 | 0.20% | 0.14% | 0.34% | 0.29% |
| 2 decks, H17 | 0.40% | 0.33% | 0.53% | 0.47% |
| 6 decks, S17 | 0.41% | 0.34% | 0.55% | 0.47% |
| 6 decks, H17 | 0.62% | 0.53% | 0.76% | 0.67% |
| 8 decks, S17 | 0.43% | 0.35% | 0.57% | 0.50% |
| 8 decks, H17 | 0.64% | 0.56% | 0.80% | 0.70% |
Blackjack pays 6:5
| Decks and dealer rule | DAS, no surrender | DAS, late surrender | No DAS, no surrender | No DAS, late surrender |
|---|---|---|---|---|
| 1 deck, S17 | 1.27% | 1.24% | 1.39% | 1.38% |
| 1 deck, H17 | 1.44% | 1.41% | 1.58% | 1.56% |
| 2 decks, S17 | 1.57% | 1.51% | 1.71% | 1.66% |
| 2 decks, H17 | 1.77% | 1.70% | 1.91% | 1.85% |
| 6 decks, S17 | 1.77% | 1.70% | 1.91% | 1.83% |
| 6 decks, H17 | 1.98% | 1.89% | 2.12% | 2.03% |
| 8 decks, S17 | 1.79% | 1.71% | 1.93% | 1.86% |
| 8 decks, H17 | 2.00% | 1.91% | 2.16% | 2.06% |
All 64 rule sets assume double on any two cards, resplit to 4 hands, no resplitting or hitting split Aces, and a dealer who peeks for blackjack. The 95% margin on each figure is ±0.008 points.
How to read it:
- The payout is the biggest single rule. Every 6:5 game in the table is worse than every 3:2 game. The best 6:5 game (1 deck, S17, DAS, late surrender: 1.24%) still costs three times as much as an ordinary 6-deck 3:2 shoe.
- Decks matter less than people think, once you're past two. Going from 6 decks to 8 adds only 0.01 to 0.04 points. Going from 6 to 1 takes off about 0.5.
- H17 adds about 0.2 points, whatever the deck count. No DAS adds about 0.14. Late surrender saves 0.02 to 0.10 points: least in single deck, most in 6 and 8 decks with H17.
- Rules interact a little. The surrender saving grows with H17 and with more decks, and the H17 cost is smaller in single deck (0.17) than in 6 or 8 decks (0.21). That's why you can't always just add the single-rule deltas, though the error from adding them is usually a couple of hundredths of a point.
For what each of these rules means at the table, see our blackjack rules guide. It has a full section on each rule.
Which rules move the house edge most
If you can only check a few things before you sit down, check them in this order. Each figure is the change from our base rules, measured with common random numbers:
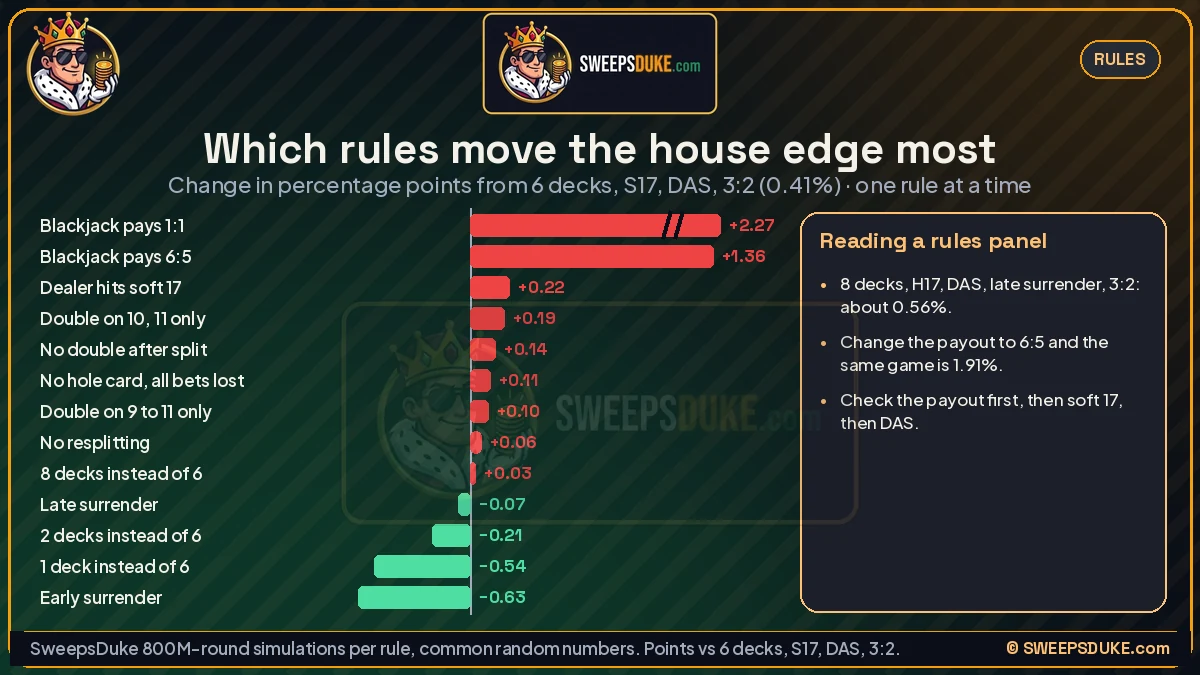
| Rule change from base | Change in house edge | Base becomes |
|---|---|---|
| Blackjack pays 1:1 | +2.27 points | 2.68% |
| Blackjack pays 6:5 | +1.36 points | 1.77% |
| Dealer hits soft 17 | +0.22 points | 0.62% |
| Double on 10 and 11 only | +0.19 points | 0.59% |
| No double after split | +0.14 points | 0.55% |
| No hole card (dealer doesn't peek, you lose doubles and splits to a blackjack) | +0.11 points | 0.52% |
| Double on 9, 10 and 11 only | +0.10 points | 0.51% |
| No resplitting | +0.06 points | 0.47% |
| 8 decks instead of 6 | +0.03 points | 0.43% |
| Late surrender | −0.07 points | 0.34% |
| 2 decks instead of 6 | −0.21 points | 0.20% |
| 1 deck instead of 6 | −0.54 points | 0.13% player edge |
| Early surrender | −0.63 points | 0.22% player edge |
A worked example of reading a rules panel. Suppose a table says: 8 decks, dealer hits soft 17, double after split allowed, late surrender, blackjack pays 3:2. Start from the 8-deck S17 DAS figure, 0.43%. Add H17 (+0.21 in 8 decks) and subtract late surrender (−0.09 with H17): about 0.56%. The lookup table gives 0.56% for exactly this game. Now change the payout to 6:5 and it's 1.91%. One line in the rules turned a 0.56% game into a 1.91% one: more than three times the cost per round.
Playing style and other games, briefly
Everything above assumes perfect basic strategy. The edge depends at least as much on how you play as on the rules. Our earlier simulations (same base rules, 800 million rounds each) give:
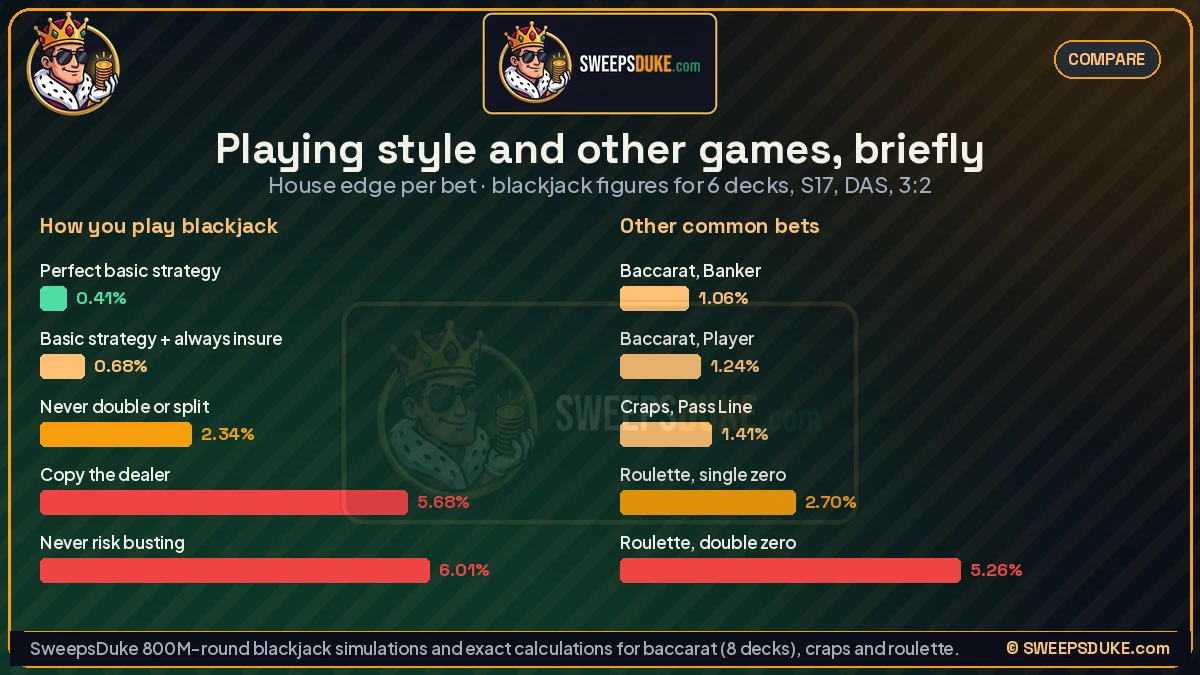
| How you play | House edge |
|---|---|
| Perfect basic strategy | 0.41% |
| Basic strategy, but always taking insurance | 0.68% |
| Never double or split | 2.34% |
| Copy the dealer (hit to 17, never double or split) | 5.68% |
| Never risk busting (stand on 12 or more) | 6.01% |
And for context, the house edge on some other common bets: baccarat Banker 1.06%, baccarat Player 1.24%, craps Pass Line 1.41%, single-zero roulette 2.70%, double-zero roulette 5.26%. With basic strategy and good rules, blackjack is one of the lowest-edge games you can play. Played badly, it's worse than roulette.
We go through each style, and why the dealer's rules beat a player who copies them, on our what is blackjack page. The full strategy and its exceptions are in our blackjack strategy guide and the printable cheat sheet.
Variance and standard deviation: the size of the swings
The house edge is the average result. Variance measures how far single results scatter around it. Standard deviation (SD) is the square root of the variance, in the same units as the bet, so it's the easier one to think in.
For our base rules, the per-round outcome distribution is:
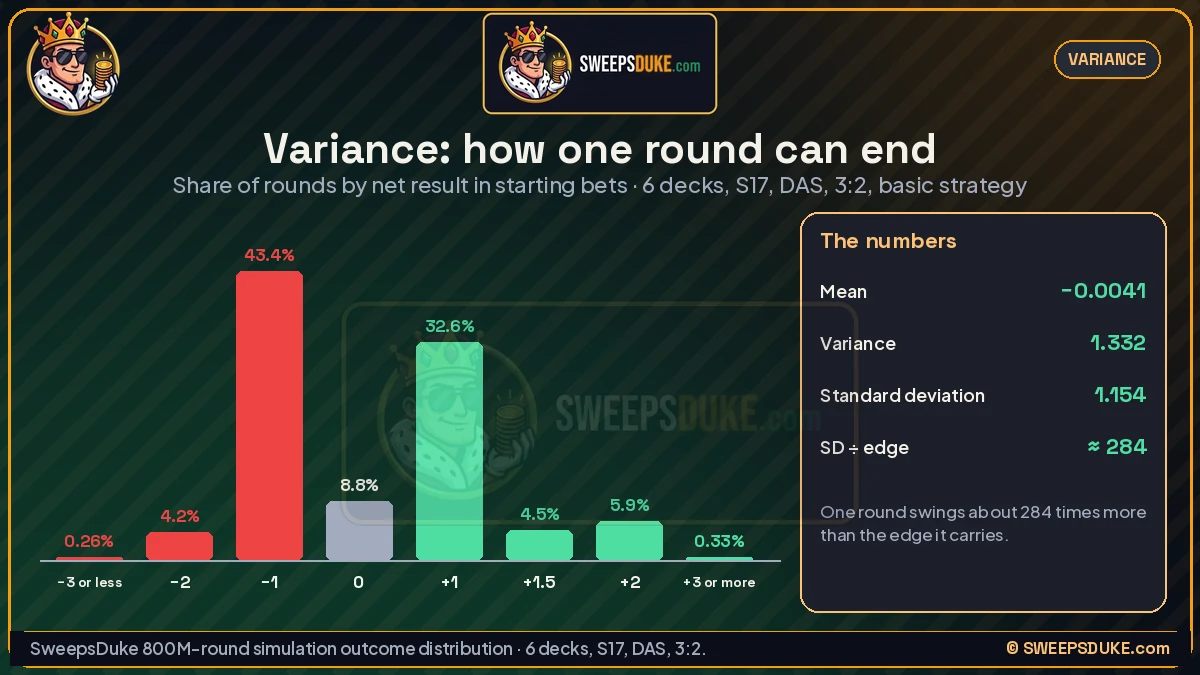
| Result of one round, in starting bets | How often |
|---|---|
| −3 or worse (lost a split or a double after split) | 0.26% |
| −2 (lost a double, or both hands of a split) | 4.20% |
| −1 | 43.41% |
| 0 (push) | 8.78% |
| +1 | 32.64% |
| +1.5 (blackjack paid 3:2) | 4.53% |
| +2 | 5.86% |
| +3 or better | 0.33% |
The mean of that distribution is −0.0041 and the variance is 1.332. The SD is √1.332 = 1.154 starting bets per round, the same as our simulator measures directly. It's a little over 1 because doubles and splits sometimes put 2 or more bets at stake.
Two rules of variance make SD useful:
- Variance adds up across independent rounds; SD grows with the square root. Over n rounds, the SD of your total result is 1.154 × √n starting bets. For 100 rounds that's 11.5 bets, for 10,000 rounds 115 bets.
- The expected loss grows in a straight line. Over n rounds it's 0.0041 × n starting bets. For 100 rounds 0.41 bets, for 10,000 rounds 41 bets.
So after 100 rounds, the swing (11.5 bets) is 28 times the expected loss (0.41 bets). After 10,000 rounds, the swing is still 2.8 times bigger. That ratio is the real reason blackjack feels nothing like a 0.41% game in the short run.
Rules change SD a little. In our 64 rule sets it ranges from 1.10 to 1.16. 6:5 lowers it slightly (1.138 for 6 decks S17) because blackjacks pay less. Late surrender lowers it because you swap some full losses for half losses. No DAS lowers it because fewer big hands get played. None of these changes is big enough to matter for your session. The edge changes are what matter.
How many hands until the edge shows
When does the house edge become a bigger factor than luck? A clean way to put it: when does the expected loss reach one standard deviation of the result? Set 0.0041n = 1.154√n and solve:
n = (SD ÷ edge)² = (1.154 ÷ 0.004062)² ≈ 80,700 rounds
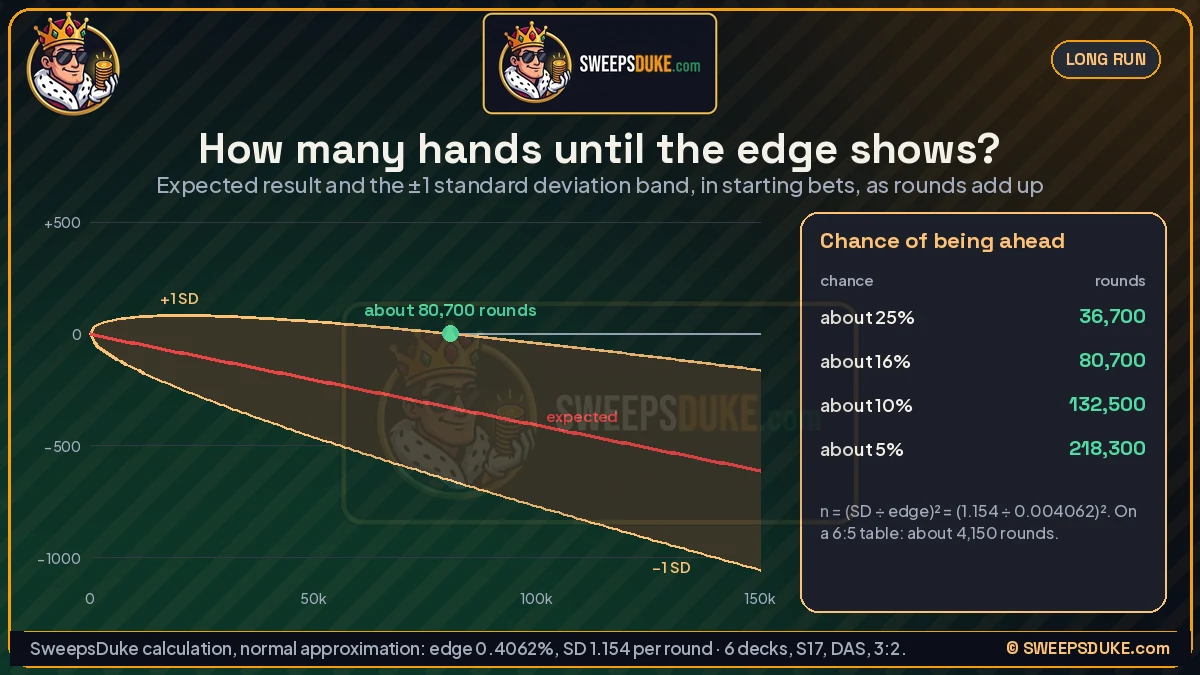
Beyond that point the edge dominates. Before it, luck does. You can use the same formula with other multiples of the SD to see how the chance of being ahead shrinks (normal approximation, base rules):
| Chance of being ahead | Rounds needed | At 100 rounds an hour |
|---|---|---|
| About 25% | 36,700 | 367 hours |
| About 16% (expected loss = 1 SD) | 80,700 | 807 hours |
| About 10% | 132,500 | 1,325 hours |
| About 5% | 218,300 | 2,183 hours |
Because the edge sits on the bottom of the fraction, worse rules shorten this a lot. On a 6:5 shoe (edge 1.77%, SD 1.138), the same point comes after only (1.138 ÷ 0.01766)² ≈ 4,150 rounds. That's about 20 times sooner. In our simulations, the share of 10,000-round sessions finishing ahead drops from 36.2% on a 3:2 game to 6.0% on 6:5.
This is also why the house edge works for the game's operator and not for any single player. The game sees millions of rounds a day, far past 80,700. You see a few hundred.
Why short sessions swing so much
Here is the chance of finishing ahead after a session of flat one-coin bets, from our simulations, next to the normal-approximation estimate:
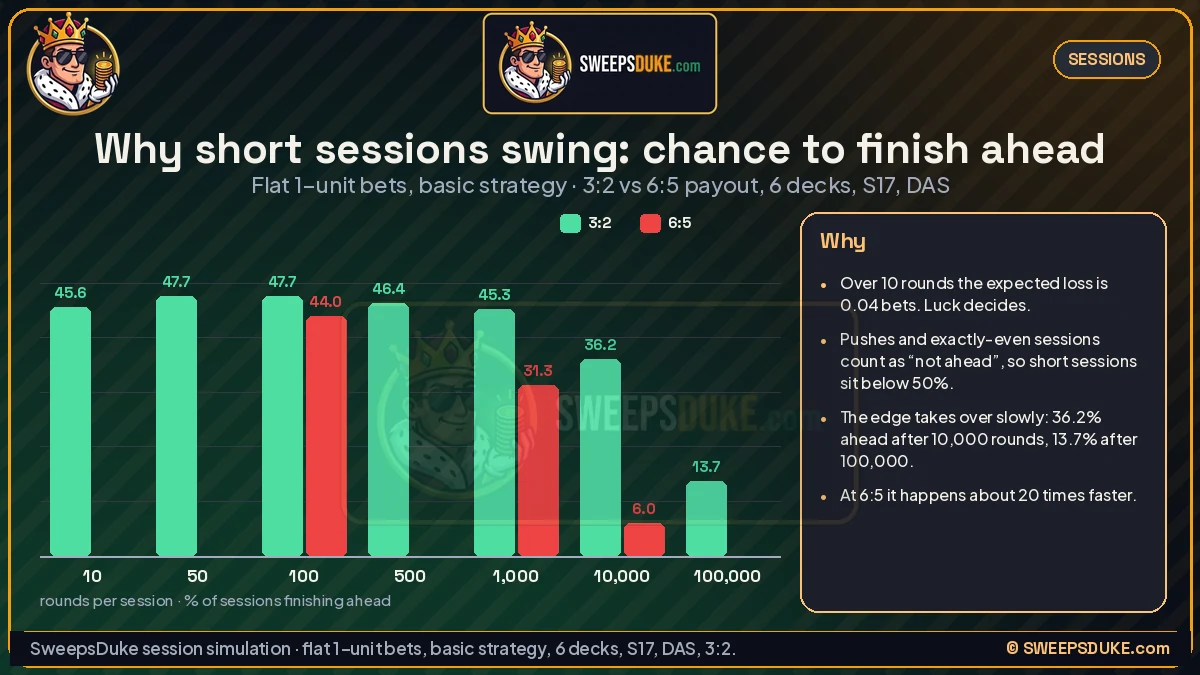
| Session length | Finished ahead (3:2, base rules) | Normal approximation | Finished ahead (6:5) | Expected result (3:2) | Middle 90% of results (3:2) |
|---|---|---|---|---|---|
| 10 rounds | 45.6% | 49.6% | not run | −0.04 | −6 to +6 |
| 50 rounds | 47.7% | 49.0% | not run | −0.2 | −13.5 to +13.5 |
| 100 rounds | 47.7% | 48.6% | 44.0% | −0.4 | −19.5 to +18.5 |
| 500 rounds | 46.4% | 46.9% | not run | −2.0 | −44.5 to +40.5 |
| 1,000 rounds | 45.3% | 45.6% | 31.3% | −4.0 | −64 to +56 |
| 10,000 rounds | 36.2% | 36.2% | 6.0% | −40 | −229 to +149 |
| 100,000 rounds | 13.7% | 13.3% | not run | −401 | −990 to +197 |
Each 3:2 row is 2 million sessions, except 10,000 rounds (400,000 sessions) and 100,000 rounds (20,000 sessions).
Why the numbers look the way they do:
- Over 10 rounds, the edge is almost invisible. The expected loss is 0.04 bets, and the result is decided by a handful of hands. You finish ahead 45.6% of the time and not 49.6% because pushes and exactly-even sessions count as "not ahead": a short session often ends at exactly 0.
- The chance of being ahead peaks at around 50 to 100 rounds, at 47.7%. With more rounds, fewer sessions end at exactly even. Past that point, the edge starts to drag the whole distribution down.
- The median follows the mean. At 1,000 rounds the median session is −4 and the mean is −4. The swings are roughly symmetric around the expected loss. Blackjack doesn't have slot-style "most lose a little, a few win big" skew.
- The normal approximation gets better with length. At 1,000 rounds and beyond it matches the simulation to within half a point.
A short winning session tells you nothing about the edge, and neither does a short losing one. With a 1.15 SD per round, a 100-round result anywhere from −19.5 to +18.5 bets is ordinary.
Bankroll risk: how long a balance lasts
The edge tells you the average cost per round. Your balance tells you how many rounds you can afford before a bad run ends the session. We simulated one-coin flat bets from four starting balances:
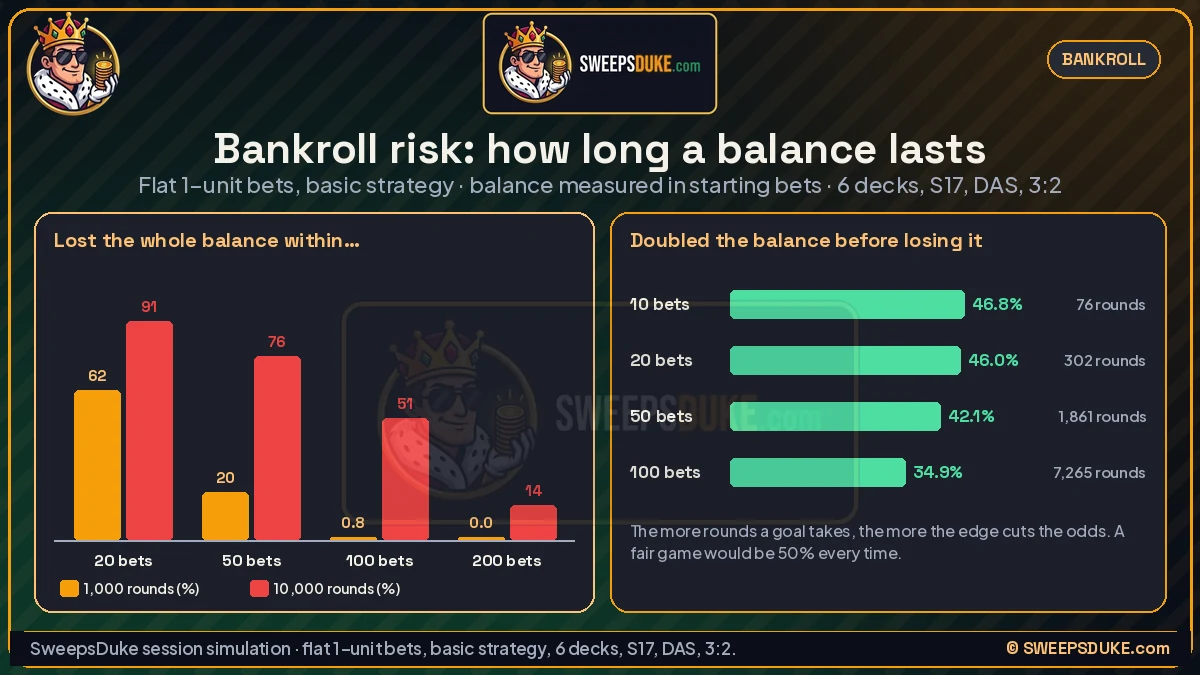
| Starting balance (in bets) | Lost it all within 1,000 rounds | Lost it all within 10,000 rounds | Doubled it before losing it all | Average rounds to double or bust |
|---|---|---|---|---|
| 10 | not run | not run | 46.8% | 76 |
| 20 | 62.4% | 91.1% | 46.0% | 302 |
| 50 | 20.1% | 76.5% | 42.1% | 1,861 |
| 100 | 0.8% | 50.7% | 35.0% | 7,265 |
| 200 | 0.0% | 14.5% | not run | not run |
What the table shows:
- A small balance is mostly a variance problem. With 20 bets, the edge costs only 4 bets over 1,000 rounds, but swings of 36 bets are normal, so 62% of sessions run out.
- A large balance survives long enough for the edge to matter. With 100 bets you almost never go broke in 1,000 rounds (0.8%), but over 10,000 rounds about half of balances are gone.
- Aiming to double up gets harder the more bets it takes. Doubling 10 bets takes 76 rounds on average and succeeds 46.8% of the time. Doubling 100 bets takes 7,265 rounds, and the edge cuts the success rate to 35.0%. The classic formula for a drifting random walk, P = 1 ÷ (1 + e^(2 × edge × B ÷ variance)), gives 35.2% for B = 100. That's within a fraction of a point of our simulation.
- "Small goal, big bankroll" wins often but still loses on average. Starting with 100 bets and stopping at +10, you reach the goal 87.5% of the time. The other 12.5% of the time you lose all 100. The average result is −3.4 bets, which matches the edge times the 846 rounds played on average. The edge doesn't care how the outcomes are split.
None of these choices changes the edge per round. They only change how many rounds you play and how the results are spread. That's the same reason betting systems can't beat the edge: we simulated six betting approaches on our blackjack strategy page.
What the house edge means for Gold Coin and Sweeps Coin play
At sweepstakes casinos you play blackjack with two kinds of coins. Gold Coins are for fun and have no cash value. You get them free or when you buy a Gold Coin pack. Sweeps Coins come free, by daily bonuses, mail-in requests or as a bonus with some Gold Coin packs, and can be redeemed for prizes under each site's sweepstakes rules. No purchase necessary: you can always get Sweeps Coins free. Our guides cover what Sweeps Coins are, what Gold Coins are, how to get free Sweeps Coins and the mail-in (AMOE) route.
The coin type doesn't change the cards. With the same rules, a Gold Coin hand and a Sweeps Coin hand have the same house edge. What differs between games is the rules, so read the game's help or info screen. Look for the deck count, S17 or H17, the blackjack payout and the published RTP, and use the lookup table above to check the RTP against the rules.
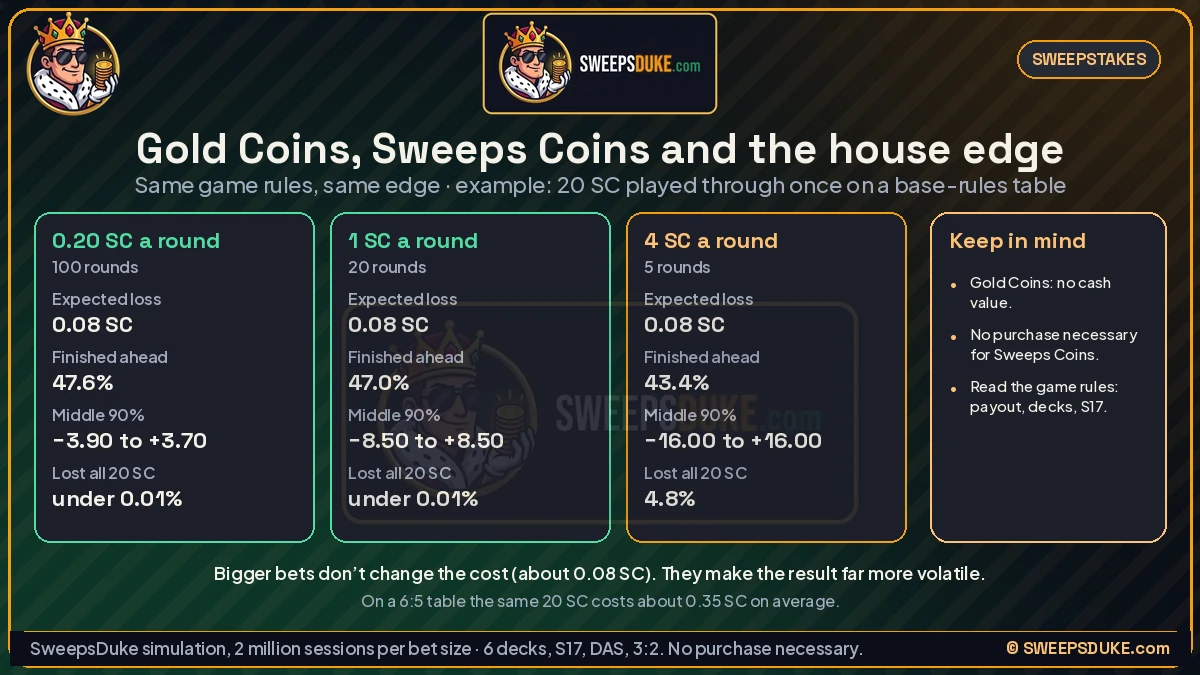
Worked example: playing through a Sweeps Coin balance. Some sites require Sweeps Coins to be played through before they can be redeemed. Suppose a site requires 1× playthrough on a 20 SC balance, so you need to bet 20 SC in total. Here are three ways to do it on a base-rules table, from 2 million simulated sessions each:
| Bet per round | Rounds | Expected loss | Finished ahead | Middle 90% of results | Lost the whole balance |
|---|---|---|---|---|---|
| 0.20 SC | 100 | 0.08 SC | 47.6% | −3.90 to +3.70 SC | under 0.01% |
| 1 SC | 20 | 0.08 SC | 47.0% | −8.50 to +8.50 SC | under 0.01% |
| 4 SC | 5 | 0.08 SC | 43.4% | −16 to +16 SC | 4.8% |
The expected cost is the same every way: 0.41% of the 20 SC bet, about 0.08 SC. What changes is the spread. Bigger bets make the result far more volatile, and with 4 SC bets almost 5% of balances are gone within five rounds. Smaller bets take longer but keep the result close to the expected cost. The 4 SC row also finishes ahead less often, because a big loss can end the session early, and a short session more often ends exactly even.
Two cautions:
- Rule quality matters more than bet sizing. The same 20 SC played through on a 6:5 table costs about 0.35 SC instead of 0.08: 1.77% instead of 0.41%.
- Playthrough rules, minimum redemptions and which games count all vary by site. Some sites count table games at a reduced rate or not at all. Check the terms before you plan around them, and see our guide to Sweeps Coin redemption methods.
Whichever coins you play with, the edge is a cost of entertainment, not a way to earn. Treat Gold Coins and Sweeps Coins as play money for the game, and stop when it stops being fun.
Common house edge myths
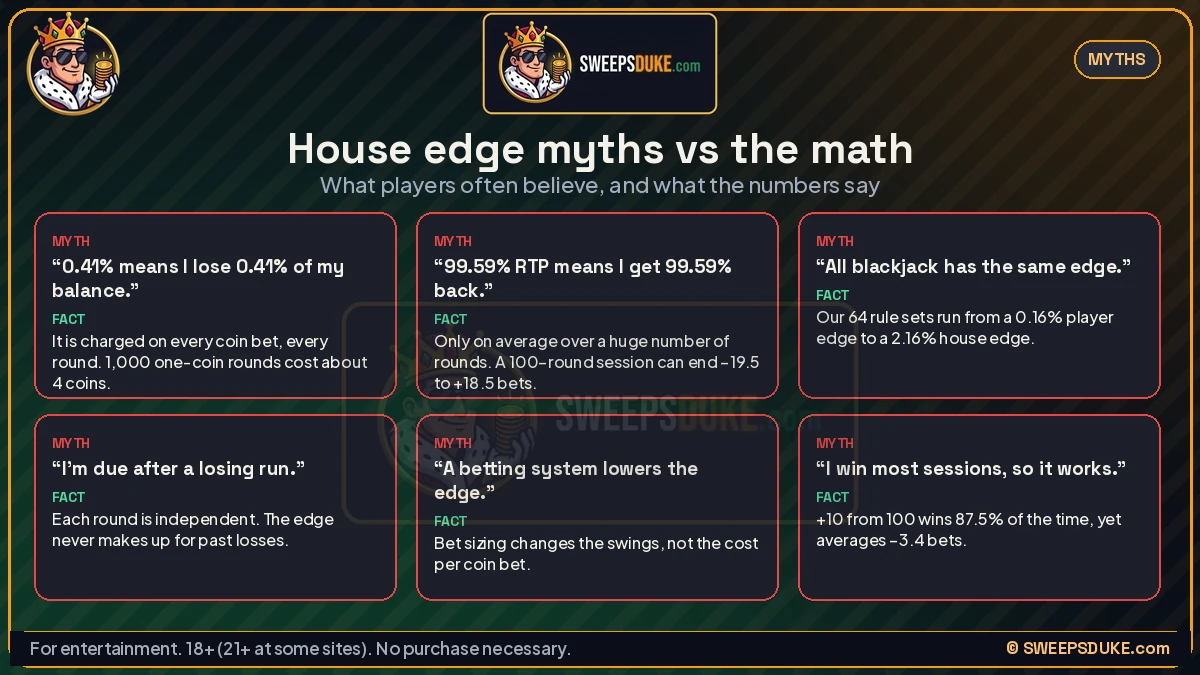
"A 0.41% edge means I lose 0.41% of my balance each session." No. The edge is charged on every coin you bet, every round. Play 1,000 one-coin rounds and the expected cost is about 4 coins, whether your balance was 50 or 5,000. Replay a balance enough times and the edge can take all of it (see the hold example above).
"99.59% RTP means I'll get 99.59% of my coins back." RTP is an average per coin bet over a very long run. Any one session can land far from it: the middle 90% of 100-round sessions runs from −19.5 to +18.5 bets.
"All blackjack has about the same edge." Our 64 common rule sets run from a 0.16% player edge to a 2.16% house edge. The payout line alone (3:2 or 6:5) moves it by 1.36 points.
"After a losing streak, I'm due a win." In a game that shuffles every round, each round is independent of the last. The edge doesn't make up for past losses. It just keeps applying to every new round.
"A betting system can lower the house edge." Changing bet sizes changes how results are spread, never the edge per coin bet. In our strategy simulations no system lowered the cost per coin bet beyond simulation noise, and the Martingale cost more (0.72 per 100 bet) because a short balance can't always afford doubles and splits.
"I win most of my sessions, so my method works." A small target with a big balance wins often: 87.5% of the time in our +10 from 100 simulation. The losing 12.5% are large, and the average is still −3.4 bets.
"Sweeps Coins or Gold Coins change the odds." The coins are just what you bet. The rules of the specific game set the edge, so read them.
"Fewer decks always means a better game." With identical rules, yes, slightly. But single-deck and double-deck games often come with 6:5 or H17. A 1-deck 6:5 game (1.27% or worse) is much worse than a 6-deck 3:2 game (0.41%).
Blackjack house edge FAQ
What is the house edge in blackjack?
About 0.41% of each starting bet on a 6-deck table where the dealer stands on soft 17, you can double after splitting and blackjack pays 3:2, with perfect basic strategy. Across 64 common rule sets it ranges from a 0.16% player edge to a 2.16% house edge.
What is the RTP of blackjack?
RTP is 100% minus the house edge. That's 99.59% for our base rules, 99.38% with H17 and 98.23% with a 6:5 payout. Always read the game's rules, because the RTP depends on them.
How is the house edge calculated?
Either exactly, by adding up probability × payout for every possible hand under a fixed strategy, or by simulating billions of rounds. Our exact calculation gives 0.402% for the base rules and our 800-million-round simulation gives 0.406%, within the simulation's margin.
Why is 6:5 blackjack so much worse?
A paid blackjack happens on 4.53% of rounds. Paying 1.2 instead of 1.5 takes 0.3 of a bet off each one: 0.3 × 4.53% = 1.36 points. That more than quadruples the edge on a 6-deck S17 game, from 0.41% to 1.77%.
How many hands does it take for the house edge to show?
About 80,700 rounds before the expected loss equals one standard deviation of the result on a base-rules table. On a 6:5 table it's about 4,150 rounds. Over a few hundred rounds, luck decides far more than the edge.
Can the house edge in blackjack be negative?
With basic strategy only on rare rule sets: single deck, dealer stands on soft 17, double after split and 3:2 gave a 0.13% player edge in our simulations, and early surrender on a 6-deck game also gives the player an edge. These rule sets are uncommon.
What's the difference between house edge and element of risk?
House edge divides the average loss by the starting bet. Element of risk divides it by all the coins wagered, doubles and splits included. For our base rules that's 0.41% vs 0.36%.
Is the house edge the same with Gold Coins and Sweeps Coins?
Yes, if the game rules are the same. The coin type doesn't change the cards, only the rules do. Check the game's rules or info screen for the deck count, the dealer rule and the blackjack payout.
Methods: Exact figures come from our finite-shoe calculation of basic-strategy expected value for 6 decks, S17 and H17, by dealer upcard. Rule-set figures come from our simulator: 64 rule sets, each 8 × 100 million rounds with common random numbers, basic strategy for the deck count and dealer rule, one player, flat bets. Session and bankroll figures come from a separate card-by-card simulator with flat one-unit bets, base rules, a fresh shuffle every round and doubles or splits only when the balance covers them. Normal-approximation figures use edge 0.4062% and SD 1.154. All figures: SweepsDuke, 2026-10-26. More on how we test: our methodology.
18+ (21+ at many sweepstakes sites). Play for fun, not income. Blackjack has a house edge, and no strategy, system or count turns a sweepstakes or casino game into a way to make money. Set a time and spend limit before you start. Need help? Call or text 1-800-GAMBLER or see our responsible gaming page.